Case Study - Web Server Performance (FlatSpikes)
Published July 25, 2025
Written by
Dmytro Kharchenko
Introduction
A web server is just a computer. A system running a program, just like the one you are reading this article from. It has a defined amount of computational resources and limits.
Not having your server under control, or at leas under reasonable observation, can lead to unexpected situations like unwanted downtime, slow response times, and unforseen expences.
To ensure that your servers perform well, extra measures should be taken to determine, measure, and consequently - control server performance metrics.
Server Productivity Metrics & Measurement Methods
Regardless of logical purpose of the server, server systems have similar productivity metrics. For decent control of the server system, it makes sense to measure such metrics as:
CPU load
RAM memory usage
SWAP memory usage
Network upload and download
These metrics allow to calculate further statistics:
Average response time
Peak response time
Peak request
Error rate
Methods of measurement are pretty straightforward.
For Node.js server programs, measuring performance of a code block, funciton, or operation is as simple as calling 2 functions:
...
monitor_start();
set of instructions;
monitor_end();
...
monitor_start() & monitor_end() will capture the timestamps before and after the instruction set, which, when subtracted, gives us the speed of execution.
In this way, you can, for example, measure an API route response time like this:
...
server.get("/", (_, res) => {
    monitor_start();

    // ...
    // Business logic
    // ...

    // Response sent
    res.sendStatus(200);

    monitor_end();
})
...
By adding one more function you can monitor errors:
...
server.get("/", (_, res) => {
    monitor_start();

    // ...
    // Business logic
    // ...

    // Response sent
    if(ok){
        res.sendStatus(200);
    }
    else if(error){
        res.sendStatus(500);
        monitor_error();
    }

    monitor_end();
})
...
In this case makes sense to code monitor_error() function in a way that does not stop route code execution (as in, does not block it or return out of it), because you still want the monitor_end() function to run to get its measurement.
As you can observe, we are taking measurements in multiple steps, using multiple functions that create multiple records. To be able to accurately calculate and judge obtained system performance data, we must have a way of distinguishing one set of request events from another. For this, the concept of correlation id is used.
Correlation id is basically a unique identifier that is generated for each particular request chain, which in our case can be attached to measurement data records. In this way, when processing our data we will be able to correlate, for example, request measurement start to measurement end without mixing up different requests.
For server processes, makes sense to use a standalone system measurement utility that quietly runs in the background, or, if your server is on Linux, which according to statistics, most web servers are, use native Linux programs and tools.
After measurements are taken, all this information can be parsed into convenient graphs and reports which will simplify analysis, understanding, and ease decision making.
Structure & Tech
FlatSpikes consists of 3 distinct parts:
System module: program for measuring server system performance metrics.
Server module: program for measuring Node.js programs and routes performance.
Report module: program that generates reports based on the measurements of previous two modules.
These modules are written in Rust. Rust is a general-purpose programming laguage that is characterized by its unique syntax, the accent on perfomance, as well as memory efficiency and safety. This programming language does not adhere to a specific programming paradigm, instead its architecture was influenced by the ideas of funcitonal programming, like immutabliity, higher-order functions, algebraic data types, and pattern matching, as well as object-oriented programming, in features like structs, enums, traits, and methods.
Because Rust gives developers an ability to thoroughly control memory, this language is of ten used for low-level system programming.
Memory safety is ensured first of all through strict type system and borrow checker functionality.
FlatSpikes Server
This module is a library that is intended to be integrated with Node.js programs and servers.

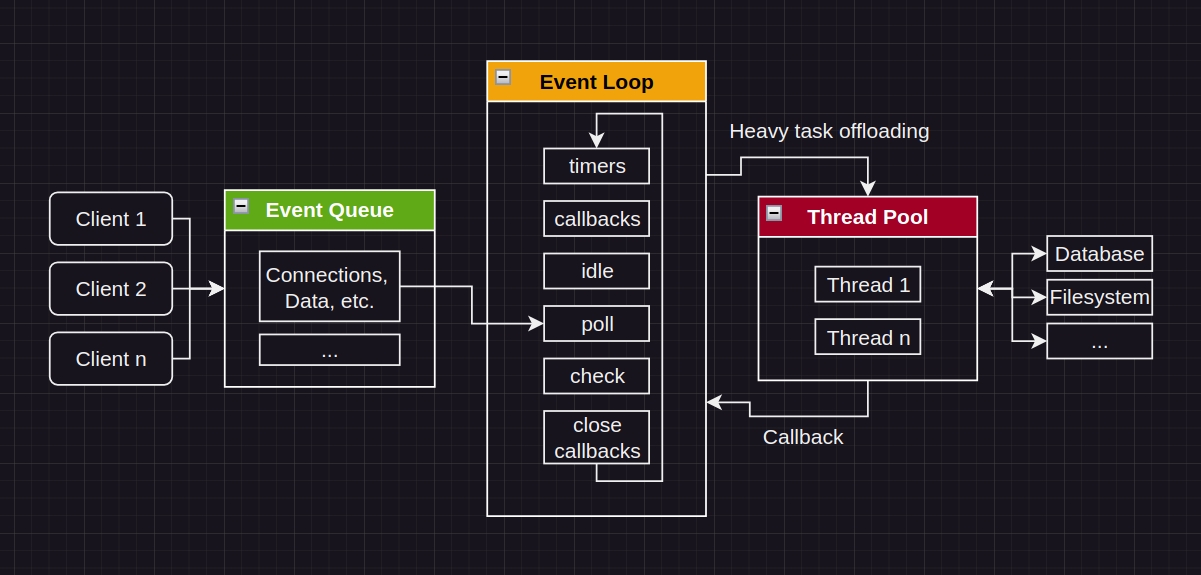
Looking at Node.js architecture above, the server module library, because of the way it is built, will be executed in the Thread Pool, technically, connecting to the server program from "outside" and taking performance measurements, minimizing the impact on server application performance.
The last thing you'd want is your measurement tools to impact your measurements. FlatSpikes makes sure this does not happen.
If you want to dive in a bit deeper into the topic of how Node.js works, read a very useful article about why you should not block the event loop.
FlatSpikes server tool measures performance through the concept of tags. Tags are configured by the developer and later used to measure application performance. The library is actually pretty simple, it exposes only two functions:
init() - funciton for tag and data configuration.
monitor() - function that takes measurement of a particular tag.
Because of the differences in memory and types management of Rust and Node.js, these two functions must convert data passed from Node into Rust's stricter format. For example:
...
fn init(mut cx: FunctionContext) -> JsResult<JsUndefined> {
    let given_tags_config = cx.argument::<JsObject>(0)?;
...
Here we are accepting the first argument of the init function, of type JsObject.
...
let tag: String = cx.argument::<JsString>(0).unwrap().value(&mut cx);
...
Here we are converting the tag name from JsString into the Rust's String for further processing.
To use the library in Node.js, you'd first initialize the tag configuration:
...
const correlator = require("express-correlation-id");
const flsp = reqire("index.node");
...
server.use(correlator());

flsp.init({
    req_start: {
        save_path: "data_from_node.json"
    },
    req_end: {
        save_path: "data_from_node.json"
    },
    req_error: {
        save_path: "data_from_node.json"
    },
});
Here we have configured three monitor tags which save data into the same JSON file. We have also made sure to setup the correlator.
Now we can, for example create route middleware and chain it to our API routes:
...
const rps_start = (req, res, next) => {
    flsp.monitor("req_start", correlator.getId());
    next();
}
const rps_end = (req, res, next) => {
    flsp.monitor("req_start", correlator.getId());
    next();
}
...

server.get("/", rps_start, (req, res, next) => {
    // Business logic
    res.sendStatus(200);
}, rps_end)


server.get("this-errors", rps_start, (req, res, next) => {
    // Business logic
    throw new Error("...");
}, rps_end)

server.use((err, req, res, next) => {
    flsp.monitor("req_error", correlator.getId(), "Stack: "+err.stack);
    flsp.monitor("req_end", correlator.getId(), "Route threw.");
    res.sendStatus(500);
})

...
In this simplified example we are creating two middleware functions and attaching them around our routes to monitor request start and end.
Notice how, in case of an error, we have to duplicate request end tag to still get the measurement. The alternative, that would not require duplication, would be to handle the error locally (inside the route function), instead of passing it to the global handler.
FlatSpikes System
This module is a command line tool.
It accepts a configuration file as the first argument, then, based on the configuration, collects performance metrics:
./flatspikes_system config.tomlConfiguration file is written in the following format:
[system]
name = "system"
# ..., timestamp, cpu, mem, net
metrics = ["timestamp", "cpu", "mem", "net"]
is_active = true
save_path = "./sys_data.json"
update_interval = 1000

[[process]]
name = "node"
# ..., timestamp, time, mem, cpu, disc
metrics = ["..."]
is_active = true
save_path = "./node_data.json"
update_interval = 1000

[[process]]
name = "redis"
metrics = ["timestamp", "mem"]
is_active = true
save_path = "./redis_data.json"
update_interval = 1000
In this example we have configured FlatSpikes to monitor all available system metrics, all node process metrics, as well as timestamp and memory usage of redis process. All measurements will run with 1 second interval and save dat ato specified locations.
FlatSpikes Report
This module is a command line tool that transforms other tool's data into convenient human-readable output.
This tool accepts data arrays from stdin in the following shapes:
[] OR [[],[], ...]Thus, it can generate one or multiple reports simultaneously, depending on the way data is passed.
FlatSpikes is written for Linux servers, thus passing system data to the program is done using pipes |:
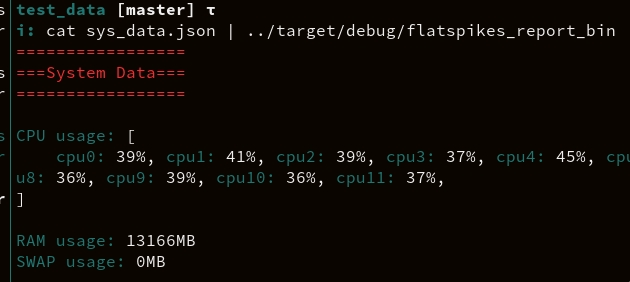
cat ./sys_data.json | flatspikes_reportAn example output would look like this:

To pass multiple data sources the awk command can be used:
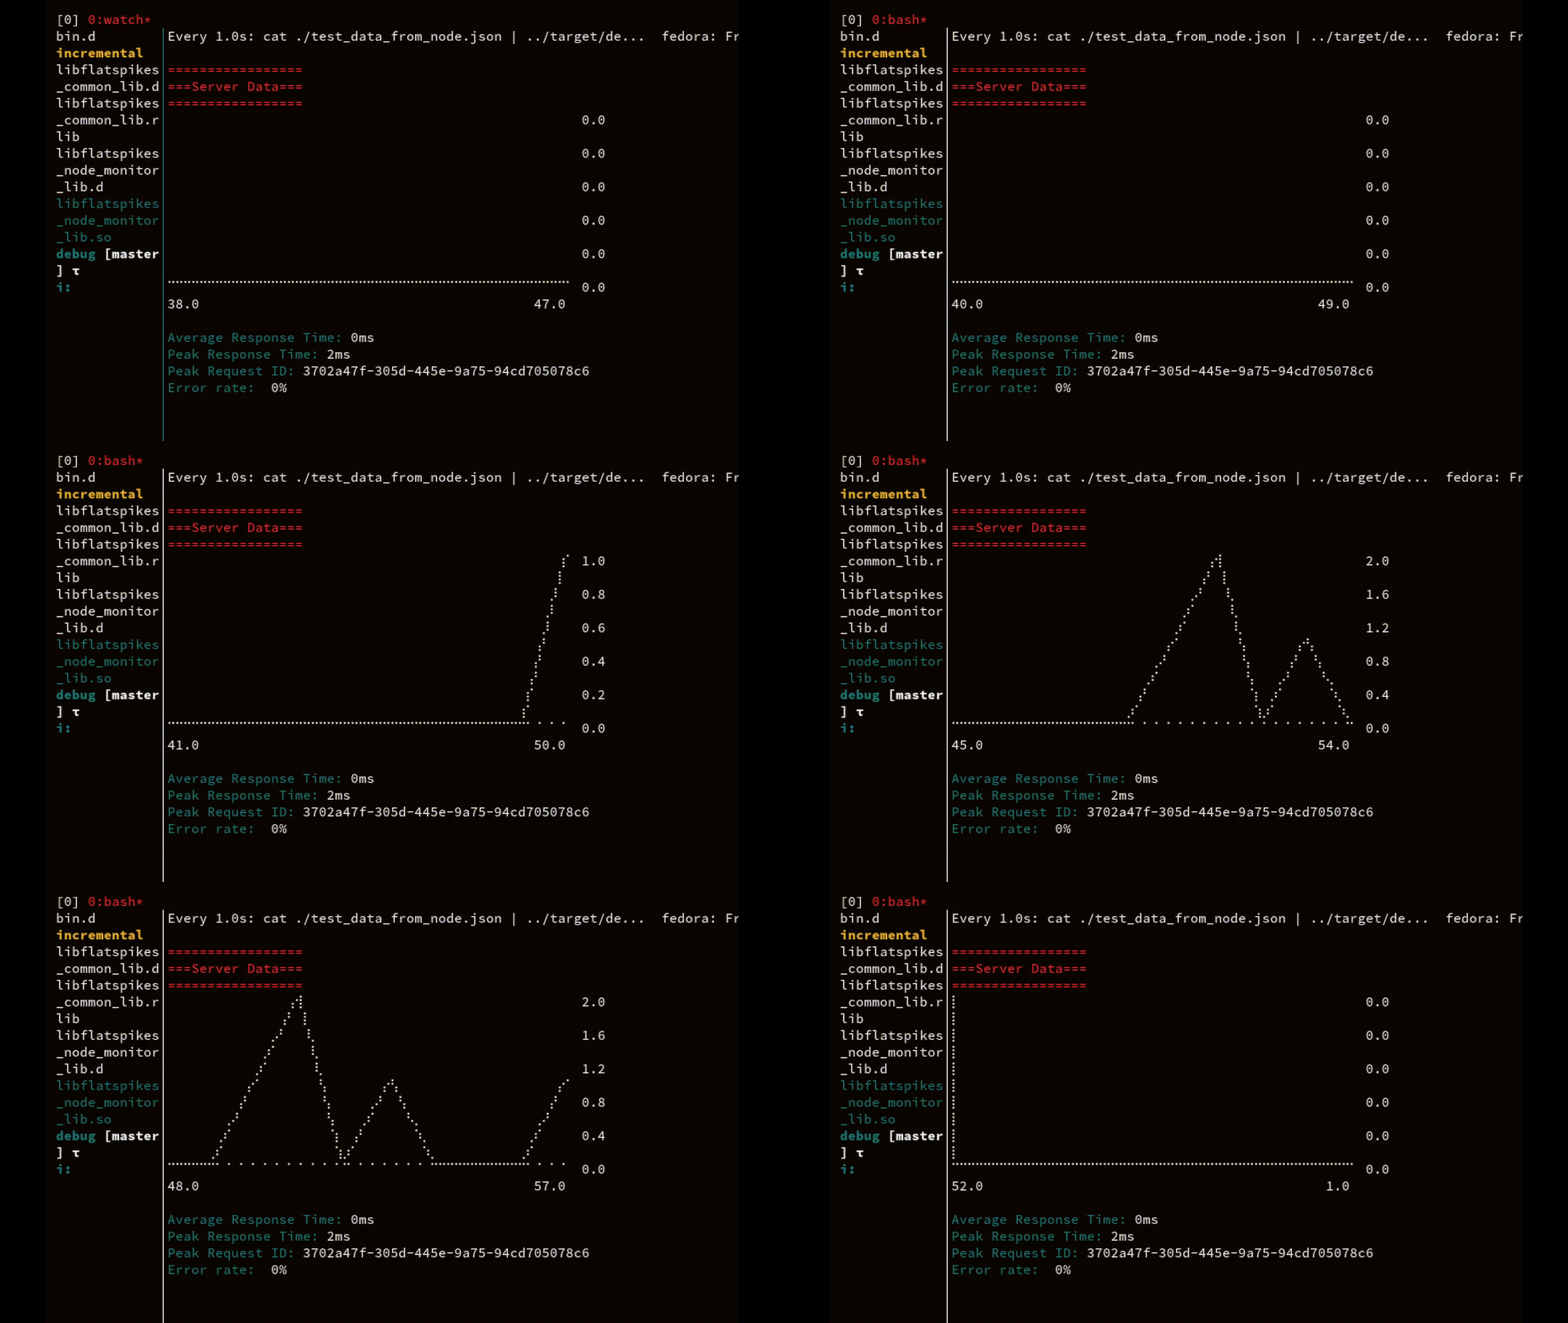
awk 'NR==FNR {f=$1;next} {print "[" f "," $1 "]"}' ./node_data.json ./sys_data.json | flatspikes_reportIt is also possible, by combining watch and cat commands, to monitor Node.js server requests and metrics live directly from server's command line:
watch -n1 cat "./node_data.json | flatspikes_report"
As you can see, tight integration into Linux command line makes FlatSpikes tools very easy and convenient to use.
Conclusions
FlatSpikes toolset, by virtue of its architectures and tight integration into the Linux command line allows engineers to conveniently monitor server system performance metrics with minimal computational impact.
Having server systems and processes under such control will help cost management, infrastructure scaling, and can even help determine, prevent, and diagnose security threats.
Resources
Project: FlatSpikes
Documentation:
Libraries: